$0.00
What the federal minimum wage buys today — in 2010 dollars.
Still $7.25 an hour on paper since 2009. After FICA and rent, the math doesn’t close. Scrub the years. Watch the top 1% pull away from the bottom half. Built from public data — every figure tagged verified claimed or guess.
The trap · GIF + live model
Gross pay. FICA first. Rent second. Nothing left.
Federal min wage is still $7.25/hr (since 2009). Work full-time: ~$1,257 gross a month. Before groceries, Social Security and Medicare (employee FICA 7.65%) come out. What’s left is about $1,161. Average U.S. rent is ~$1,900+. You’re underwater before food, transit, or a single dollar of savings — while the top 1% holds about a third of all household wealth.

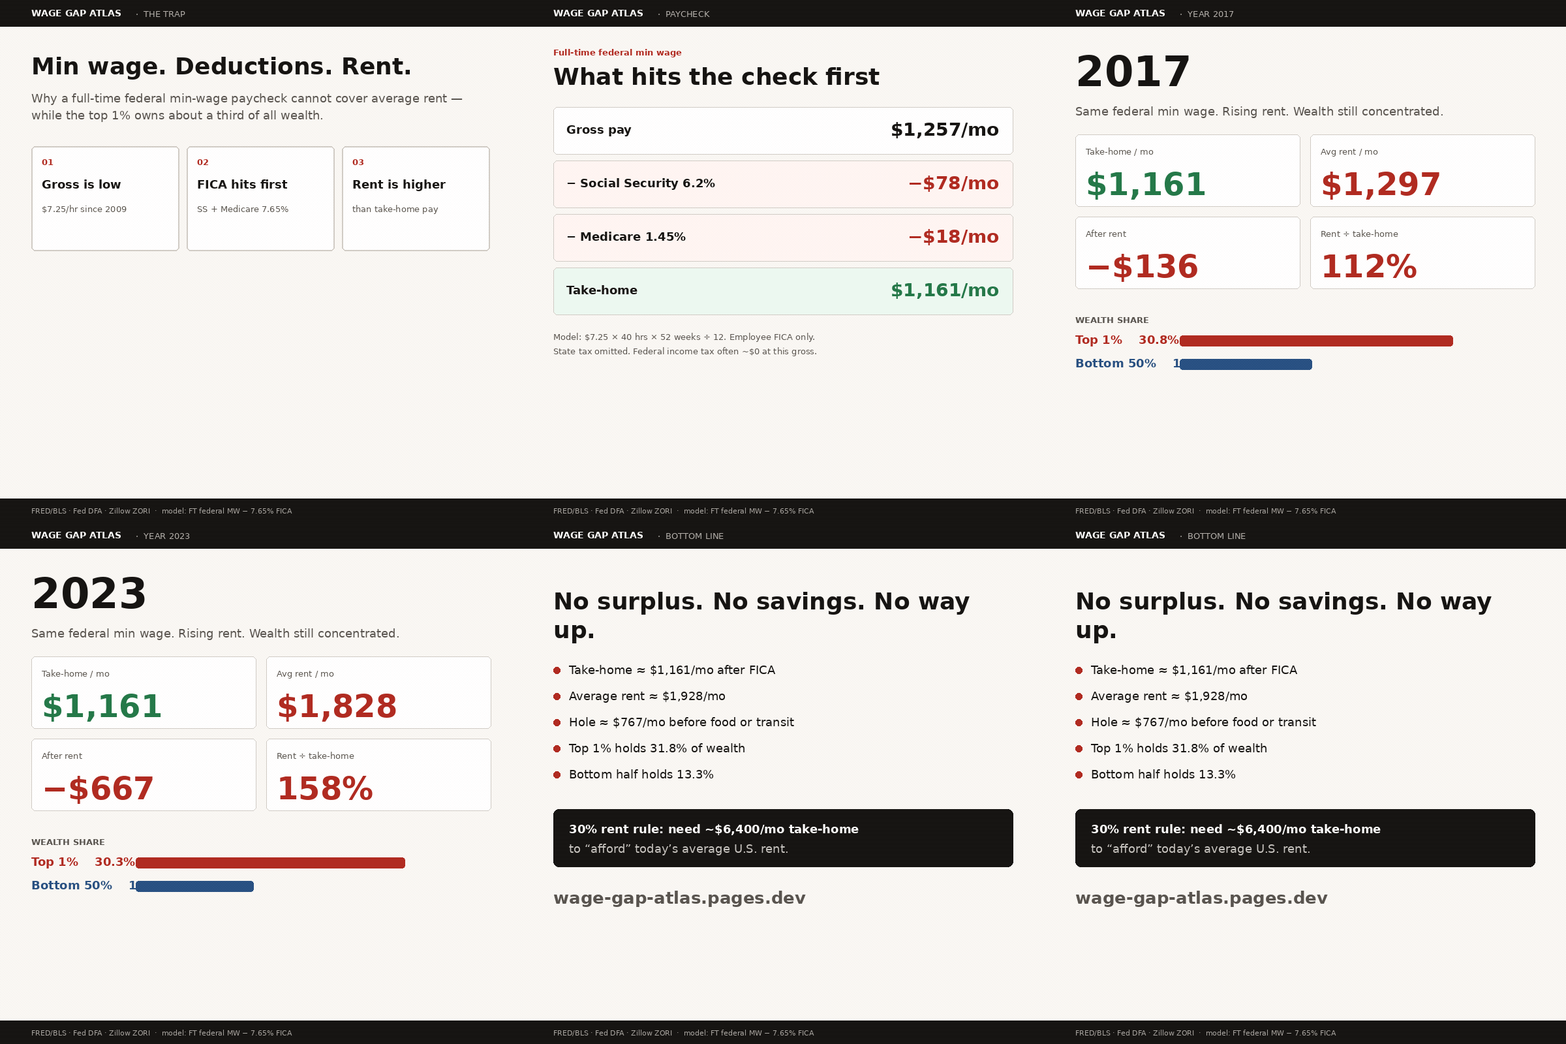
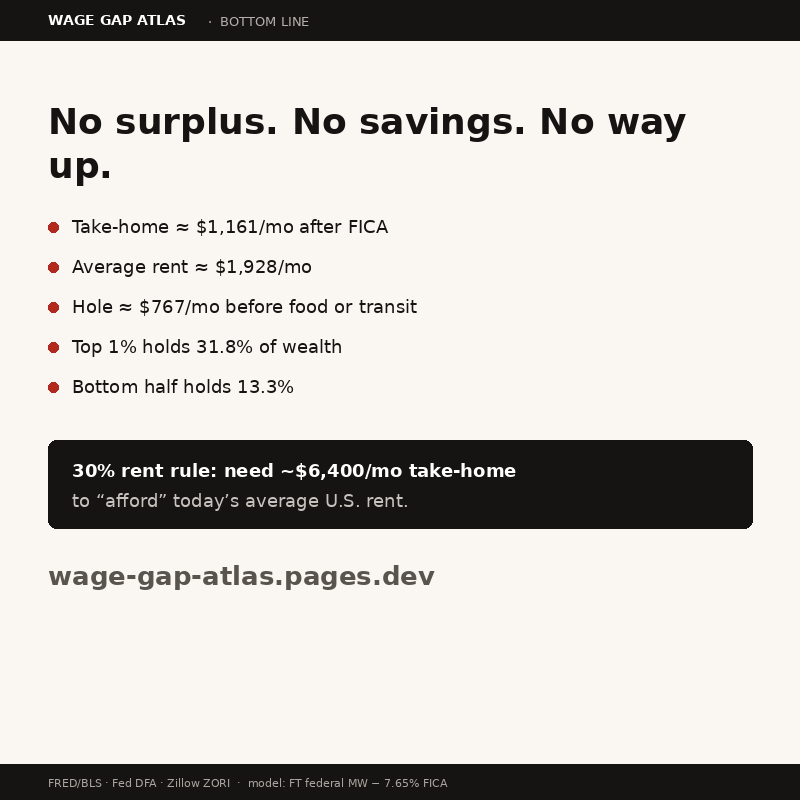
verified federal MW · FICA rate · Fed wealth shares · claimed Zillow ZORI U.S. rent · guess take-home = gross − employee FICA only (no state tax; federal income tax often ~$0 at this gross after the standard deduction — still no room to live). Full-time = 40×52. Not personal advice.
National playhead
Drag a year. Watch the country change.
Inflation, shelter, mortgages, wealth shares, and CEO pay on one scrubber. Values are annual averages or year-end observations from the loaded series.
Distributional Financial Accounts
Who owns the stock of wealth.
Not income this month — the pile of assets minus debts. The bottom half of U.S. households holds a sliver; the top 1% holds about a third.
verified Fed Distributional Financial Accounts via FRED (WFRBST01134, WFRBST01122, WFRBST01110). Shares sum with the middle bands omitted from this simplified three-bar view — open method for full cuts.
EPI · productivity vs pay
Output per hour rose. Typical pay did not keep pace.
claimed Economic Policy Institute State of Working America (indexes, base near 1948).
State map table · 2023
Where a paycheck buys a roof.
Sort by home price-to-income, min wage, or private-sector average pay. Homes are Zillow typical values (claimed); income and QCEW wages are public series (verified).
| State | Min wage | Median HH income | Typical home | Price / income | Years @ min wage | Avg private pay |
|---|
Stress signal
Bankruptcy filings are climbing again.
claimed U.S. Courts year-ending December totals (business + nonbusiness). County detail (F-5A) is on storagebox for a later map layer.
Method & limits
How to read this without getting lied to.
This is a data study, not a product pitch. Numbers come from government series and published research libraries. We label honesty so viral charts do not outrun the evidence.
What this build does not claim
- Zillow ZHVI is a model of typical home value, not a Census transaction median.
- EPI CEO and productivity series are research constructs on CPS/NIPA — labeled claimed.
- County rent burden (ACS) needs a Census API key — next pull.
- Local city minimum wages are not fully layered yet; state effective rates use FRED STTMINWG + federal floor.
- A few states without FRED MW series fall back to the federal floor (guess) when history is thin.